 sciBASIC#
↖
sciBASIC#
↖
08 Tutorial — UMAP manifold
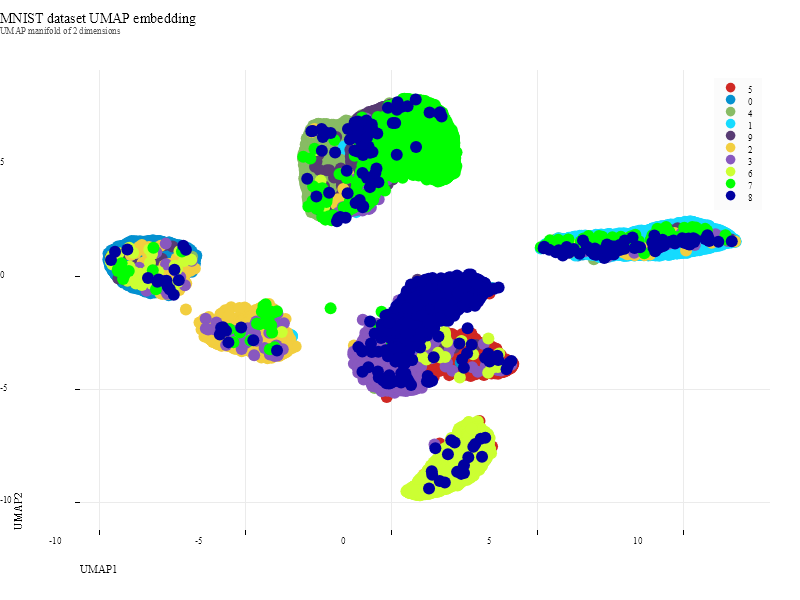
Project 20,000 handwritten digits onto a 2-D UMAP manifold, colored by label.
A 20,000-digit slice of the MNIST training split — grayscale 28 × 28 digits, 784 pixel features each — is read straight from the original idx3/idx1 binary files, wrapped into a NumericTable and pushed through the sciBASIC# UMAP implementation: 2 target dimensions, 128 nearest neighbors. The resulting manifold is rendered as a Nature-themed scatter in which every point carries its digit label as color, and the full coordinate table streams back to CSV.
02 Pipeline
From idx binaries to a labeled manifold
Load
MNIST reads train-images-idx3-ubyte + train-labels-idx1-ubyte from
the --data folder; ExtractDataSet(Of ClusterEntity) streams labeled 784-D feature
rows and the first limit = 20000 land in a NumericTable (features
p_1–p_784 + the class label column).
Reduce
table.umap(dims := 2, neighbors := 128) builds the fuzzy simplicial set over the
784-dimensional space and optimizes the low-dimensional layout in one call — the returned
manifold table carries features dim_1 / dim_2 and inherits the row names and
class labels.
Plot
A ScatterPlot (800 × 600, PlotTheme.Nature) draws UMAP1 vs UMAP2 with
each point colored by its digit label, saved at 300 dpi.
Export
manifold.WriteCsv streams the embedding table (dim_1, dim_2, label:class) to
CSV in the standard label: layout.
01 The Script
Full demo source
The complete script exactly as executed by the sciBASIC# script engine (vbs.exe) — nothing elided.
#include "Microsoft.VisualBasic.DataMining.UMAP.dll"
#include "Microsoft.VisualBasic.MachineLearning.DataStorage.dll"
#include "Microsoft.VisualBasic.DataMining.Framework.dll"
#include "Microsoft.VisualBasic.Drawing.dll"
#include "Microsoft.VisualBasic.Data.DataPlot.dll"
#include "Microsoft.VisualBasic.Math.Randomizer.dll"
#include "Microsoft.VisualBasic.Data.Framework.dll"

imports Microsoft.VisualBasic.Data
imports Microsoft.VisualBasic.Data.Framework
imports Microsoft.VisualBasic.MachineLearning.DataStorage
imports Microsoft.VisualBasic.DataMining.ComponentModel.EntityModels
imports Microsoft.VisualBasic.DataMining.UMAP
imports Microsoft.VisualBasic.DataMining
imports microsoft.visualbasic.data.plots
imports microsoft.visualbasic.drawing

' The MNIST training set contains 60000 samples and running UMAP on the full set
' is very expensive, so this tutorial script only takes the first ``limit``
' samples for the demonstration (increase limit to process more samples)
dim limit = 20000
dim repo_data = ?"--data"
dim mnist as new MNIST(
    $"{repo_data}\train-images-idx3-ubyte",
    $"{repo_data}\train-labels-idx1-ubyte")

' ---------------------------------------------------------------------------
' 1. Build the handwritten digit samples of MNIST into a unified 2D table
'    object (NumericTable)
'
'    + feature columns = p_1 .. p_784, i.e. the pixel grey levels of the image
'    + label column   = class, i.e. the digit category of every sample
'
'    All the following operations (dimension reduction, clustering, export) are
'    performed directly on this single table
' ---------------------------------------------------------------------------
dim rows As Double()() = New Double(limit - 1)() {}
dim classes(limit - 1) as double
dim i = 0

for each digit in mnist.ExtractDataSet(of ClusterEntity)()
    if i >= limit then exit for

    rows(i) = digit.entityVector
    classes(i) = CDbl(digit.cluster)
    i += 1
next

' The number of samples actually read may be smaller than limit
if i > 0 andalso i < limit then
    redim preserve rows(i - 1)
    redim preserve classes(i - 1)
end if

dim table = NumericTable.FromRows(
    fieldname("sample", n := rows.length).toarray(),
    rows,
    fieldname("p", n := rows(0).length).toarray())
call table.SetLabel("class", classes)

call console.WriteLine($"mnist table: {table.nsamples} samples x {table.nfeatures} pixels")

' ---------------------------------------------------------------------------
' 2. Use UMAP to reduce the 784-dimensional pixel data to two dimensions
'
'    The umap method accepts the unified 2D table and returns a new table whose
'    features are the embedding coordinates dim_1..dim_2; the row names and the
'    existing class label column are inherited
' ---------------------------------------------------------------------------
dim manifold = table.umap(dims := 2, neighbors := 128)

call console.WriteLine($"umap embedding: {manifold.nsamples} samples x {manifold.nfeatures} dims")

' ---------------------------------------------------------------------------
' 3. Plot: UMAP1/UMAP2 scatter plot coloured by the handwritten digit class
' ---------------------------------------------------------------------------
dim x = manifold.Feature("dim_1")
dim y = manifold.Feature("dim_2")
dim number(classes.length - 1) as string

for k = 0 to classes.length - 1
    number(k) = classes(k).ToString()
next

call SkiaDriver.Register()

Using plt As New ScatterPlot(800, 600, PlotTheme.Nature())
    plt.Title = "MNIST dataset UMAP embedding"
    plt.SubTitle = "UMAP manifold of 2 dimensions"
    plt.XLabel = "UMAP1"
    plt.YLabel = "UMAP2"
    plt.Plot(DataSerials(x := x, y := y, number).tolist())
    plt.SavePng(here("mnist-umap.png"), 300)
End Using

' ---------------------------------------------------------------------------
' 4. Export the embedding table as csv
'    (dim_1, dim_2 feature columns + the label:class label column)
' ---------------------------------------------------------------------------
call manifold.WriteCsv(here("mnist-umap.csv"))

call console.WriteLine("done: mnist-umap.png")
call console.WriteLine("done: mnist-umap.csv")
03 Results
The 2-D manifold