 sciBASIC#
↖
sciBASIC#
↖
05 Tutorial — Hierarchical clustering
From a distance matrix to a dendrogram — cut it by k, or by threshold.
Hierarchical clustering answers a question k-means cannot: how do the clusters nest? The script turns the Iris feature table into a 150 × 150 distance matrix, grows the dendrogram with hca(), cuts it two ways — hcut(k := 3) and hcut(threshold := 3.0) — and cross-tabulates the result against the true species before drawing the PCA scatter and exporting the annotated table.
02 Pipeline
Distance matrix in, dendrogram out
Load
NumericTableIO.ReadCsv loads the four feature columns. Hierarchical clustering needs
unique sample names, so the duplicated species names in column one are rewritten to
sample_1…sample_150 and the true species is kept alongside as a numeric
label:species column.
Measure
The table's distanceMatrix() computes all pairwise distances into a 150 × 150
square matrix table.
Cluster
dist.hca() builds the dendrogram and dist.hcut(k := 3) cuts it into flat
clusters. A second cut by distance — hcut(threshold := 3.0) — shows the other
way to slice the tree: 2 clusters.
Validate
A cross tabulation compares the flat clusters against the real species, straight from the script's console loop.
Plot
table.pca(maxPC := 2).ScoreTable() projects the four measurements onto PC1/PC2 and a
Nature-themed ScatterPlot colors the points by hierarchical cluster.
Export
table.SetLabel("cluster", labels) writes the cluster ids back onto the original feature
table and WriteCsv saves it.
01 The Script
Full demo source
The complete script exactly as executed by the sciBASIC# script engine (vbs.exe) — nothing elided.
#include "Microsoft.VisualBasic.DataMining.HierarchicalClustering.dll"
#include "Microsoft.VisualBasic.Data.Framework.dll"
#include "Microsoft.VisualBasic.Data.DataPlot.dll"
#include "Microsoft.VisualBasic.Math.Statistics.ANOVA.dll"
#include "Microsoft.VisualBasic.Drawing.dll"

imports Microsoft.VisualBasic.Data
imports Microsoft.VisualBasic.Data.Framework
imports Microsoft.VisualBasic.DataMining.HierarchicalClustering
imports Microsoft.VisualBasic.Math.Statistics.Hypothesis.ANOVA
imports microsoft.visualbasic.data.plots
imports microsoft.visualbasic.drawing

' ---------------------------------------------------------------------------
' Hierarchical clustering demo
'
'   feature table -> distanceMatrix() -> distance matrix table
'    -> hca() dendrogram / hcut() cut into clusters
'    -> compare with the real species -> PCA scatter plot -> export csv
' ---------------------------------------------------------------------------
dim file = here("../../data/bezdekIris.csv")
dim k = 3

' ---------------------------------------------------------------------------
' 1. Load the iris dataset as the unified 2D table format
'    (first column = row names, then the D1..D4 feature columns)
' ---------------------------------------------------------------------------
dim table = NumericTableIO.ReadCsv(file, columns := {"D1","D2","D3","D4"})

' The first column of the iris file is the species name (with duplicates), but
' hierarchical clustering requires unique sample names. So the row names are
' rewritten to unique sample ids here, while the real species is mapped to a
' numeric label column named species and kept on the table.
dim species = table.rowNames
dim spNames as new List(Of String)
dim sp(table.nsamples - 1) as double
dim ids(table.nsamples - 1) as string

for i = 0 to species.length - 1
    if not spNames.Contains(species(i)) then call spNames.Add(species(i))

    sp(i) = spNames.IndexOf(species(i)) + 1
    ids(i) = "sample_" & (i + 1)
next

table.rowNames = ids

call table.SetLabel("species", sp)

call console.WriteLine($"dataset: {table.nsamples} samples x {table.nfeatures} features, {spNames.Count} species")

' ---------------------------------------------------------------------------
' 2. Feature table -> symmetric distance matrix table (Euclidean by default)
' ---------------------------------------------------------------------------
dim dist = table.distanceMatrix()

call console.WriteLine($"distance matrix: {dist.nsamples} x {dist.nfeatures} (square matrix)")

' ---------------------------------------------------------------------------
' 3. Hierarchical clustering
'
'    + hca()  returns the root node of the dendrogram
'    + hcut() cuts the dendrogram into the requested number of clusters and
'      writes the cluster id into the cluster label column
' ---------------------------------------------------------------------------
dim tree = dist.hca()
dim flat = dist.hcut(k := k)
dim labels = flat.ClusterLabels()
dim sizes(k - 1) as integer

for i = 0 to labels.length - 1
    sizes(labels(i) - 1) += 1
next

dim leafs = tree.OrderLeafs()
dim leafHead(4) as string

for i = 0 to 4
    leafHead(i) = leafs(i)
next

call console.WriteLine($"dendrogram: leafs = {tree.Leafs}, leaf order head = {String.Join(", ", leafHead)}")
call console.WriteLine($"hcut(k := {k}) cluster sizes: {String.Join(", ", sizes)}")

' Cut the dendrogram by a distance threshold (clusters are merged while the
' linkage distance is below the threshold)
dim byThreshold = dist.hcut(threshold := 3.0)
dim thresholdLabels = byThreshold.ClusterLabels()
dim clusterNumber = 0

for i = 0 to thresholdLabels.length - 1
    if thresholdLabels(i) > clusterNumber then clusterNumber = thresholdLabels(i)
next

call console.WriteLine($"hcut(threshold := 3.0) -> {clusterNumber} clusters")

' ---------------------------------------------------------------------------
' 4. Compare the clusters with the real species (cross tabulation)
' ---------------------------------------------------------------------------
for each name in spNames
    dim counts(k - 1) as integer
    dim spId = spNames.IndexOf(name) + 1

    for i = 0 to labels.length - 1
        if sp(i) = spId then counts(labels(i) - 1) += 1
    next

    call console.WriteLine($"  {name}: {String.Join(", ", counts)}")
next

' ---------------------------------------------------------------------------
' 5. Run PCA on the feature table and colour the scatter plot by the
'    hierarchical cluster id
' ---------------------------------------------------------------------------
dim score = table.pca(maxPC := 2).ScoreTable()
dim class_id(labels.length - 1) as string

for i = 0 to labels.length - 1
    class_id(i) = "cluster " & labels(i)
next

call SkiaDriver.Register()

Using plt As New ScatterPlot(800, 600, PlotTheme.Nature())
    plt.Title = "Hierarchical clustering of bezdek-Iris"
    plt.SubTitle = $"average linkage + hcut(k := {k})"
    plt.XLabel = "PC1"
    plt.YLabel = "PC2"
    plt.Plot(DataSerials(score.Feature("PC1"), score.Feature("PC2"), class_id).tolist())
    plt.SavePng(here("bezdekIris-hclust.png"), 300)
End Using

' ---------------------------------------------------------------------------
' 6. Write the hierarchical cluster ids back onto the original feature table
'    and export it as csv
'
'    The exported layout still follows the convention of
'    "row names + feature columns + label: prefixed label columns"
' ---------------------------------------------------------------------------
dim result = table.SetLabel("cluster", labels)

call result.WriteCsv(here("bezdekIris-hclust.csv"))

call console.WriteLine("done: bezdekIris-hclust.png")
call console.WriteLine("done: bezdekIris-hclust.csv")
03 Results
The PCA scatter
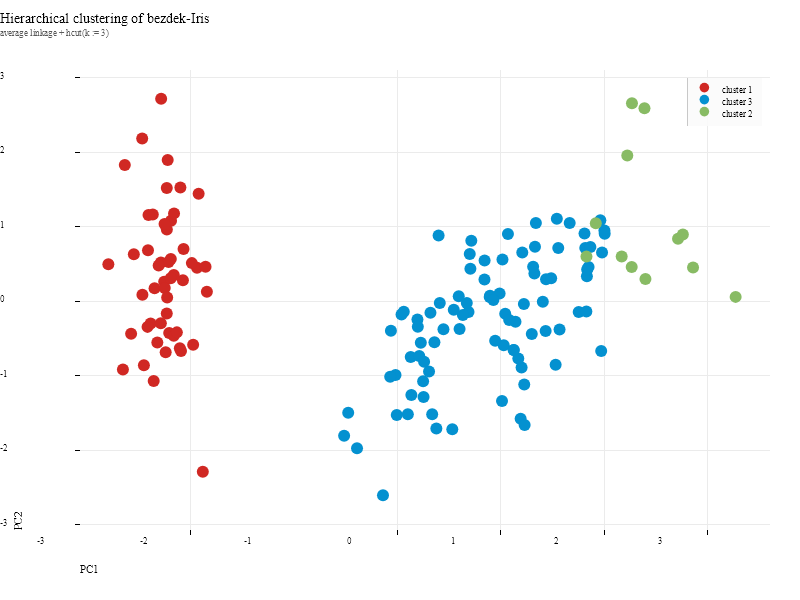
hcut(k := 3)). The plot subtitle carries the exact configuration.Console — including the species cross tabulation
The run reports the dendrogram leaf order, both cut strategies, and how the three clusters line up with the true species:
dataset: 150 samples x 4 features, 3 species
distance matrix: 150 x 150 (square matrix)
dendrogram: leafs = 150, leaf order head = sample_42, sample_23, sample_14, sample_43, sample_9
hcut(k := 3) cluster sizes: 50, 12, 88
hcut(threshold := 3.0) -> 2 clusters
  Iris-setosa: 50, 0, 0
  Iris-versicolor: 0, 0, 50
  Iris-virginica: 0, 12, 38
Calculate component 1... cost 4ms and run 17 loop [DONE]
Calculate component 2... cost 0ms and run 10 loop [DONE]
done: bezdekIris-hclust.png
done: bezdekIris-hclust.csv
Table preview — bezdekIris-hclust.csv
The exported table keeps the four raw measurements, the true species label and the assigned hierarchical cluster side by side. First rows and the last rows are shown; the full file holds all 150 data rows.
| D1 | D2 | D3 | D4 | label:species | label:cluster | |
|---|---|---|---|---|---|---|
| sample_1 | 5.1 | 3.5 | 1.4 | 0.2 | 1 | 1 |
| sample_2 | 4.9 | 3 | 1.4 | 0.2 | 1 | 1 |
| sample_3 | 4.7 | 3.2 | 1.3 | 0.2 | 1 | 1 |
| sample_4 | 4.6 | 3.1 | 1.5 | 0.2 | 1 | 1 |
| ··· | ||||||
| sample_148 | 6.5 | 3 | 5.2 | 2 | 3 | 3 |
| sample_149 | 6.2 | 3.4 | 5.4 | 2.3 | 3 | 3 |
| sample_150 | 5.9 | 3 | 5.1 | 1.8 | 3 | 3 |